Using the analytics panel
An article about the capabilities of building various analytical layouts with high-level data on preliminary payment processing results and exporting them to different formats for further use.
Overview
Dashboard allows you to analyse performance of your projects within the Ecommpay platform by using a configurable analytics panel in the Analytics section. The tools in this section draw on preliminary data on payment processing results without accounting for final fees, deductions, and adjustments, and it can be accessed only with a separate set of permissions (details).
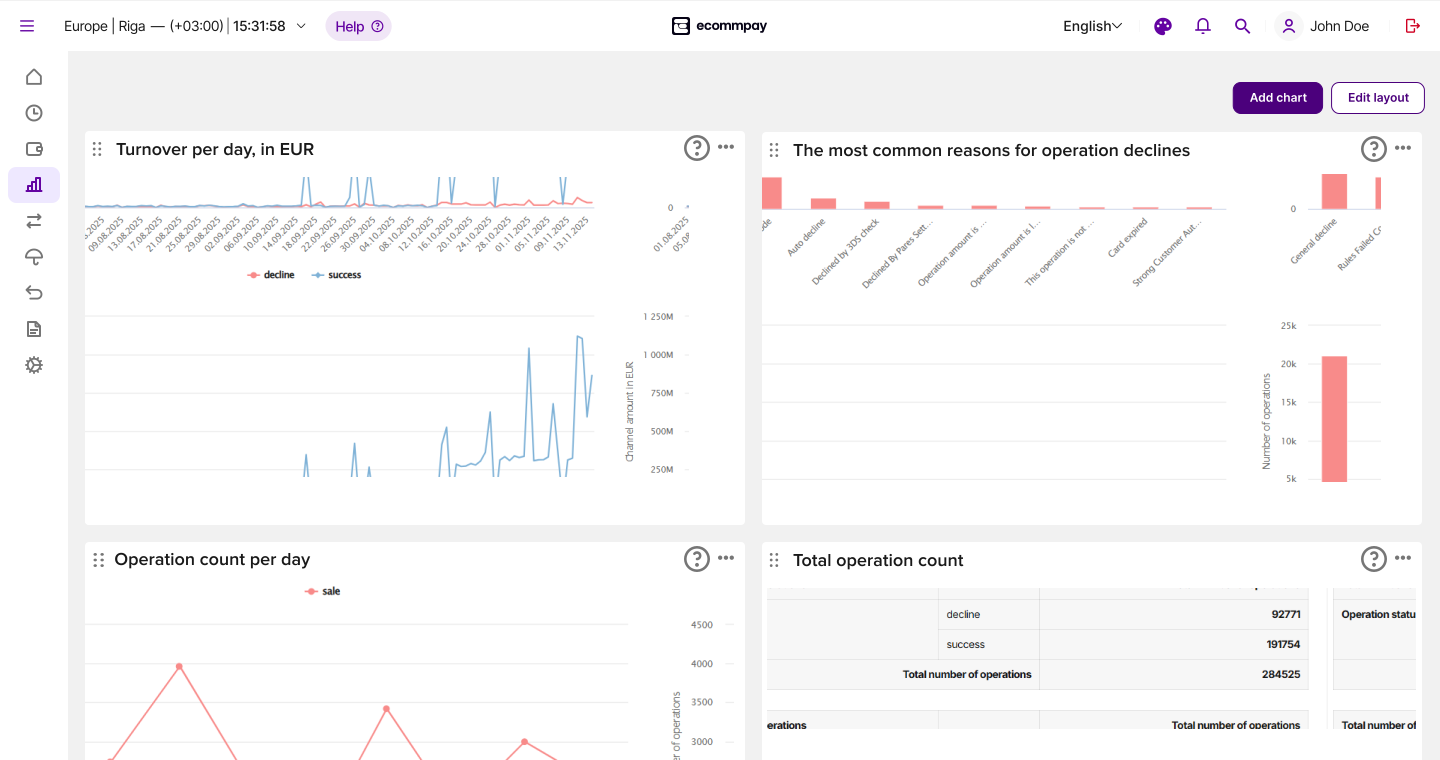
A user account with permissions to access the Analytics section can have one analytics panel displaying data for the projects available to that account. The panelthat can be customised: you can adjust the layout and arrangement of tiles with charts and tables generated on the basis of aggregated data on operations and payments broken down by different criteria. You can filter and group the available data by various parameters (such as project and payment method) and export the resulting charts and tables in different formats for use outside the Dashboard interface. Thus, a single panel allows you to build and export in different formats various analytical layouts with high-level data on preliminary results of processing payments via the Ecommpay platform.
Special aspects
When working with the analytics panel, you need to consider the following special aspects.
- Single-user access. Access to the panel and the tiles added to it is managed through user accounts, without the option to share information directly within the Dashboard interface. In addition, the time zone of the Dashboard user account affects what data is shown on the panel (details ).
- Limitations. You can only use a predefined set of tiles and aggregated data from the platform, without the option to add custom tiles or import data from other sources.
- Flexible panel configuration. You can place any available tiles on the analytics panel, including multiple tiles of the same type, and configure their arrangement, but the total number of tiles in use at any one time must not exceed ten. Once you reach this limit, the option to add new tiles becomes disabled until you remove at least one tile from the panel.
- Tile scaling options. Any active tile can be expanded to full-screen mode, and you can zoom in on individual sections of charts and tables by selecting them with the cursor.
- Static data. A tile captures data current at the time of its addition based on the applied filters and remains available in this state indefinitely. If you need to update information in a tile, you can edit its properties or add a new tile with the required configuration.
- Data export options in different formats. Charts can be exported in JPEG, PDF, PNG, and SVG; tables can be exported in XLS.
Tiles
Basic structure
Each tile allows you to work with data on a specific topic (such as payment traffic, turnover, or risks) using a predefined set of capabilities. The type of a tile determines what data can be displayed on the analytics panel through that tile and in what form. Each tile type supports its own target metrics, data visualisation formats, and data filtering and grouping options. Finally, you can set an individual reporting period for each tile (from 1 day to 24 calendar months) and, where applicable, a time granularity (day, week, month, or quarter)
For example, the Operations tile allows you to create different types of charts for operation counts, average and total operation amounts, and the number of customers who initiated those operations. You can filter the source data by project, payment method, country, currency, operation type, or status—in any combination, with the support for the logical operator AND across attributes and OR across values. You can also group target metric values by any of these attributes. The Success rate tile allows you to create standard tables that show the number of successful payments relative to the total number of successful and declined payments. You can filter the source data by project, payment method, payment card issuing country, currency, and payment type—likewise in any combination, with the support for the logical operator AND across attributes and OR across values. Along the same lines, the capabilities vary for each tile type, each with its own specifics.
In addition, note that there are two modes of grouping operations by type:
- By actual operation types supported in the platform (
account verification,sale,auth,cancel,capture,refund,recurring, andpayout). This mode is supported for working with the Operations tile. - By cash flow types, with
Pay-Inindicating a cash inflow from the customer to the merchant (sale,capture, andrecurring),Refundindicating that funds transferred to the merchant as a result of processing a pay-in operation are returned to the customer, andPay-Outindicating a cash outflow from the merchant to the customer (payout). This mode is supported for working with such tiles as In/out turnover, Top 10, and Chargebacks.
Below is a brief overview of the configuration options for each tile type.
Operations in chart format
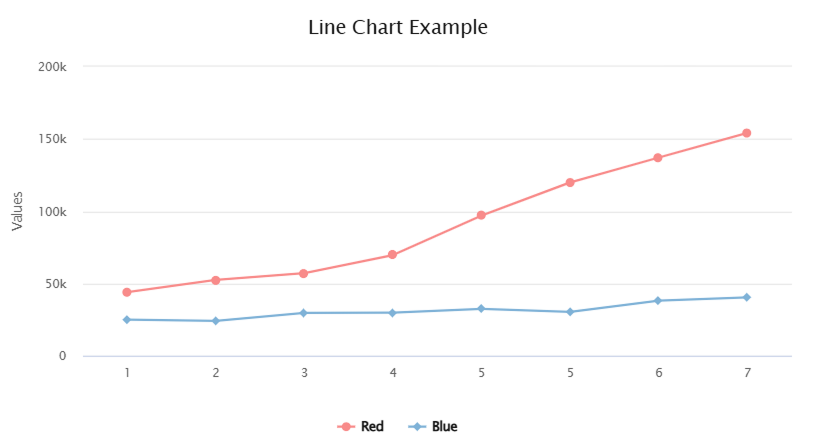
Available metrics:Metrics: total number of completed and declined operations by type · average and total operation amounts in balance currencies · number of web service customers who initiated operations.
Grouping options for target metric values:Grouping: by project, payment method, country, operation currency, type, or status—limited to a single attribute at a time.
Available data filtering options:Filtering: by project, payment method, country, operation currency, type, and status—in any combination, with boolean AND across attributes and OR across values.
Operations in a pivot table
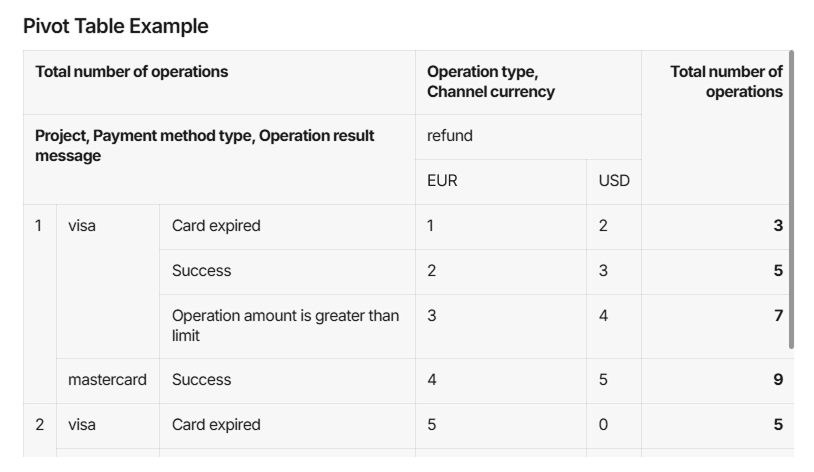
Available metrics:Metrics: total number of completed and declined operations by type · average and total operation amounts in balance currencies · number of web service customers who initiated operations.
Grouping options for target metric values:Grouping: by project, payment method, country, operation currency, type, and status, final state description, and execution date—in any combination; each attribute can be used once for column or row grouping with boolean AND applied.
Available data filtering options:Filtering: by project, payment method, country, operation currency, type, and status—in any combination, with boolean AND across attributes and OR across values.
In/out turnover in table format
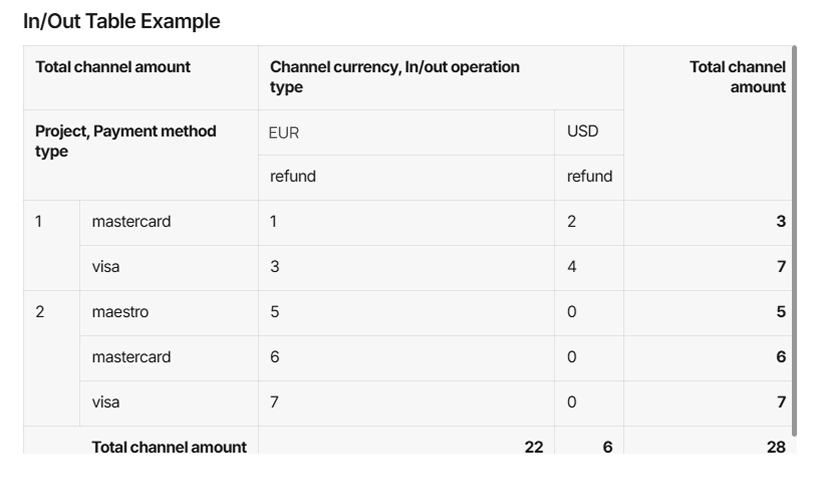
Available metrics:Metrics: total amounts of completed and declined operations by type in operation currencies (provided that the currency is selected as one of the grouping attributes, for rows or columns).
Grouping options for target metric values:Grouping: by project, payment method, cash flow type (pay-ins, refunds, payouts), and operation execution date—in any combination; each attribute can be used once for column or row grouping with boolean AND applied.
Available data filtering options:Filtering: by project, payment method, country, operation currency, and cash flow type (pay-ins, refunds, payouts)—in any combination, with boolean AND across attributes and OR across values.
Top 10 in chart format
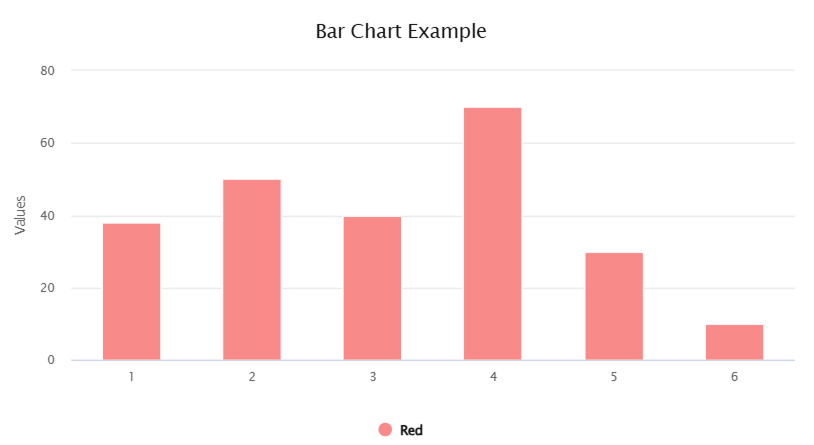
Available metrics:Metrics: number of completed and declined operations by type · total operation amounts in balance currencies.
Grouping options for target metric values:Grouping: by payment method, country, issuer, or operation decline reason—limited to a single attribute at a time.
Available data filtering options:Filtering: by project, payment method, country, and cash flow type (pay-ins, refunds, payouts)—in any combination, with boolean AND across attributes and OR across values.
Chargebacks in chart format
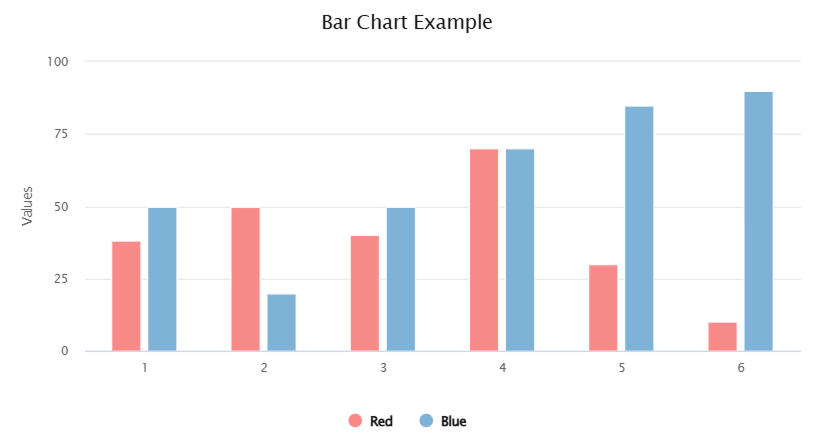
Available metrics:Metrics: number of chargebacks first reported to the platform during the selected period · total chargeback amount in balance currency · ratio of chargeback count to the total number of completed pay-in operations · ratio of chargeback amount to the total amount of completed pay-in operations in balance currency.
Grouping options for target metric values:Grouping: by project, country, payment card brand, or specific chargeback properties—limited to a single attribute at a time.
Available data filtering options:Filtering: by project, country, and payment card brand—in any combination, with boolean AND across attributes and OR across values.
Chargebacks in table format
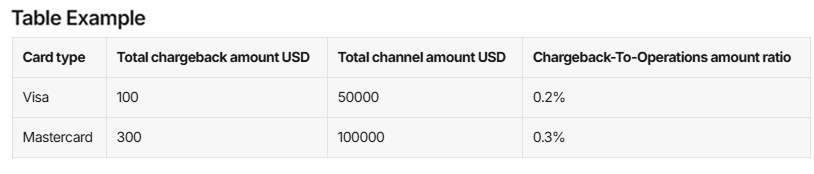
Available metrics:Metrics: number of chargebacks first reported to the platform during the selected period · total chargeback amount in balance currency · ratio of chargeback count to the total number of completed pay-in operations (including both absolute values and their percentage ratio) · ratio of chargeback amount to the total amount of completed pay-in operations in balance currency (including both absolute values and their percentage ratio).
Grouping options for target metric values:Grouping: by project, country, payment card brand, and specific chargeback properties—in any combination, with boolean AND applied, but for column grouping only.
Available data filtering options:Filtering: by project, country, and payment card brand—in any combination, with boolean AND across attributes and OR across values.
Risks in chart format
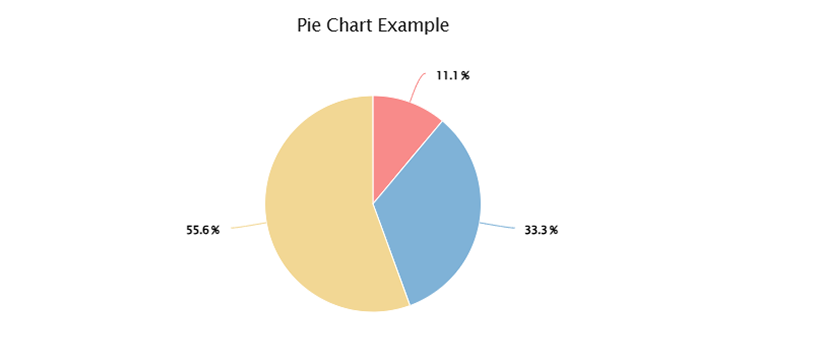
Available metrics:Metrics: number of completed pay-in operations identified as fraudulent · total amount of completed pay-in operations identified as fraudulent, in balance currency.
Grouping options for target metric values:Grouping: by project, country, payment card brand, operation type, or execution date—limited to a single attribute at a time.
Available data filtering options:Filtering: by project, country, and payment card brand—in any combination, with boolean AND across attributes and OR across values.
Risks in table format
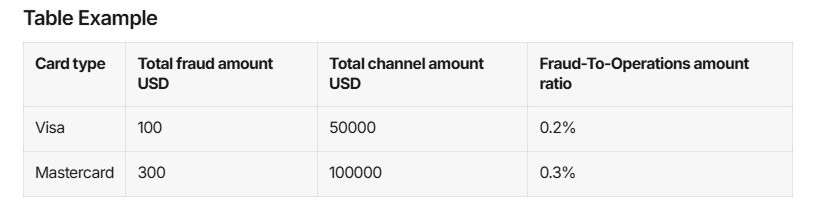
Available metrics:Metrics: number of completed pay-in operations identified as fraudulent · total amount of completed pay-in operations identified as fraudulent, in balance currency · ratio of completed pay-in operations identified as fraudulent to the total number of completed pay-in operations (including both absolute values and their percentage ratio) · ratio of the amount of completed pay-in operations identified as fraudulent to the total amount of completed pay-in operations in balance currency (including both absolute values and their percentage ratio).
Grouping options for target metric values:Grouping: by project, country, payment card brand, customer identifier, customer account, operation type, and execution date—in any combination, with boolean AND applied, but for column grouping only.
Available data filtering options:Filtering: by project, country, and payment card brand—in any combination, with boolean AND across attributes and OR across values.
Success rate in table format
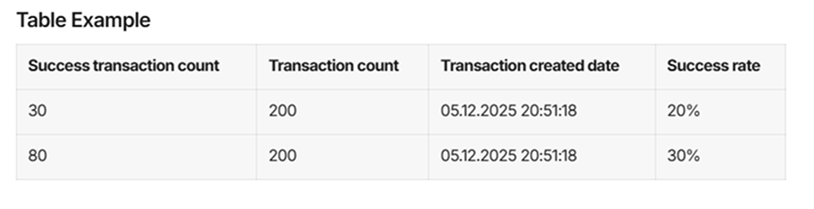
Available metrics:Metrics: number of successful payments by type · total number of successful and declined payments by type · periods in which payments were assigned their final statuses (according to the defined time granularity) · ratio of successful payments to the total number of successful and declined payments—with all metrics presented in separate table columns.
Grouping options for target metric values:Grouping: none.
Available data filtering options:Filtering: by project, payment method, payment card issuing country, payment type, and operation currency—in any combination, with boolean AND across attributes and OR across values.
Working with tiles
General information
Tiles with data visualisations can be laid out on the analytics panel in one or two columns. To change the layout, clickuse the Edit layout button in the top right corner of the section and select the option you need. To move the tiles across the panel, use the  iconplace the cursor on the icon located in the top left corner of the tile.
To work with the tiles, you can use the following tile controls:
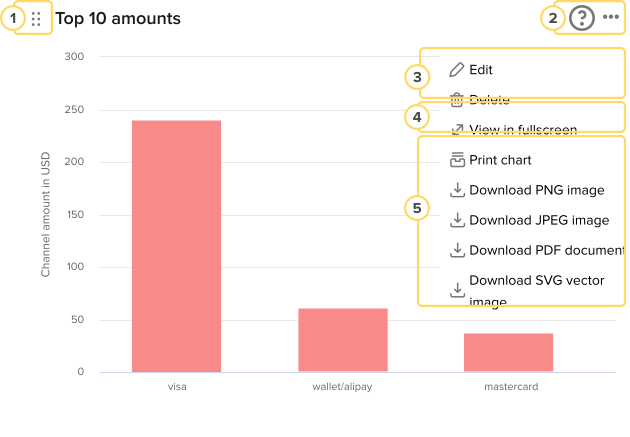
To view the tile configuration, use the tooltip that appears when you hover over the  icon or the modal window that opens when you click the
  button in the top right corner of the tile.
Adding a tile
When you add a tile, keep in mind that you can have no more than 10 charts or tables on the panel. When you reach the limit, the Add chart button will remain disabled until at least one tile is deleted.
To add a tile with a chart or a table to your analytics panel:
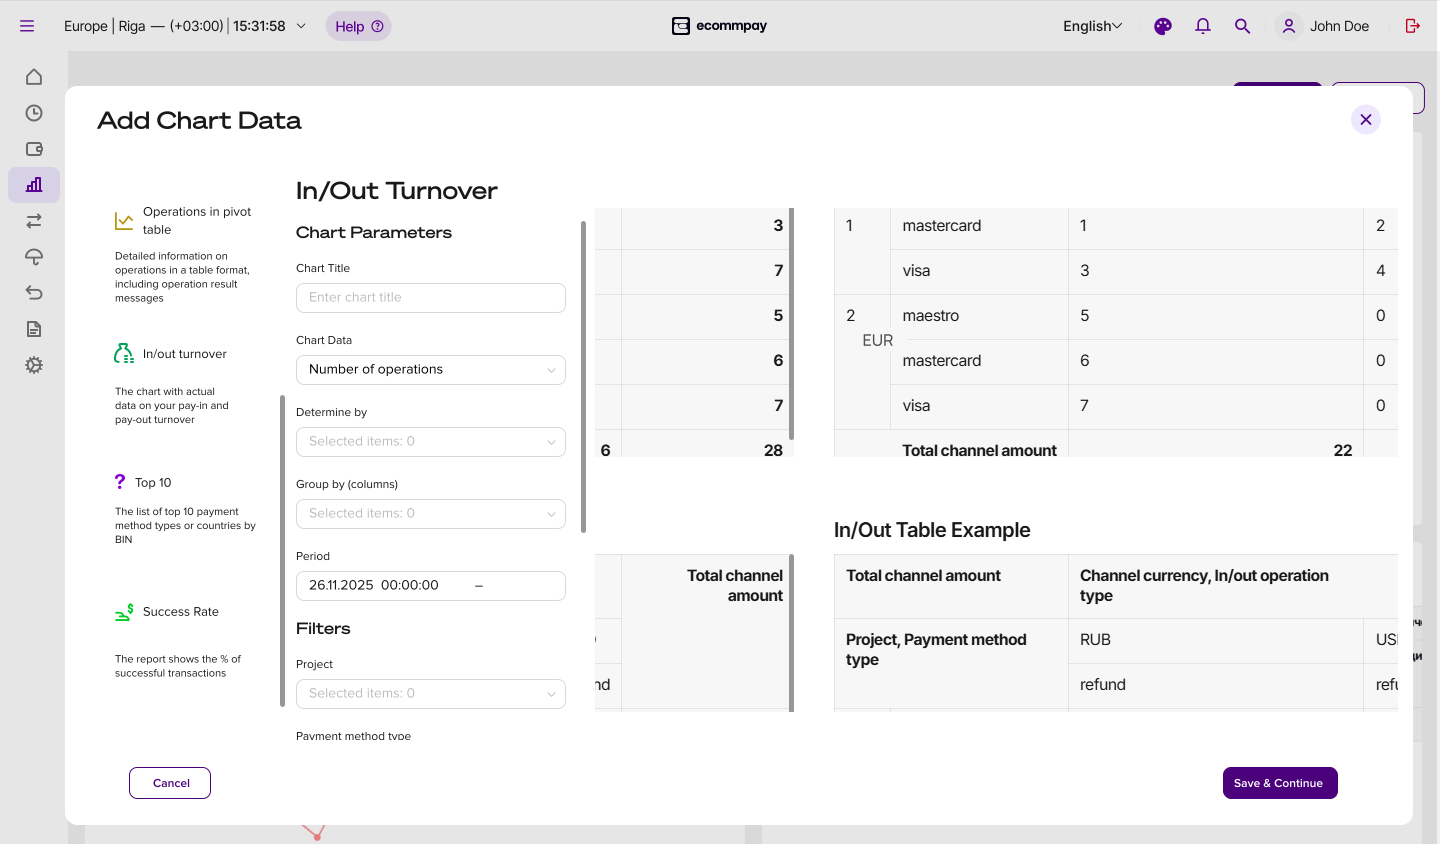
- Open the tile configuration tool by clicking Add chart.
Navigate to the Analytics section and click Add chart in the top right corner of the section.
- Configure the tile by selecting its type and specifying the required parameters.
Select the tile type on the left of the window that opens and specify the required parameters. Note that the set of mandatory parameters depends on the selected type of the tile. As a rule, mandatory parameters include the tile name, target metrics, and reporting period limits.
- Submit the request to add the tile by clicking Save and continue.
Click Save and continue in the bottom right corner of the window.
- Make sure that the tile has been added to the panel and that the information it displays is correct.
Once the request is processed, there will be a pop-up window with a notification that a new chart or table was added, after which the added tile should be displayed on the panel in accordance with the defined configuration. To check the configuration, hover over the
icon in the top right corner of the tile to view the tooltip.
Editing a tile
If needed, the configuration of a tile can be edited. To do so, open it via the action menu and the  button, make necessary changes, save them, and confirm that the changes have been applied.
To edit the configuration of a tile:
- Open the tile configuration window.
Open the action menu using the
button in the top right corner of the tile and click the button. - Make necessary changes.
Use any of the available tools in the configuration window. If you need to discard the changes, close the configuration window without saving.
- Save the changes.
Once the necessary changes have been made (with all mandatory parameters specified), click Save and Continue.
- Make sure that the changes have been applied.
Hover over the
icon in the top right corner of the tile or reopen the tile configuration in edit mode.
Deleting a tile
To delete a tile, expand the action menu using the button in the top right corner of the tile, click the  button, and make sure that the tile is no longer displayed on the panel.